KINSKI Laguerre Filter WaveThe "Laguerre Filter Wave" Indicator usually shows market cycles and is a perfect fit for swing traders who trade with market fluctuations. Upward-trends are shown as green lines and optional bands. Downward trends are represented by the color red. Each of the 18 available lines can be adjusted to your own preferences via a gamma factor.
You also have the following display options:
- "Up/Down Movements: On/Off" - Shows ascending and descending of lines
- "Bands: On/Off" - Fills the space between the lines with colors to indicate up or down trends
- "Bands: Transparency" - sets the transparency of the fill color
- "MA Line: Size" - sets the width of the lines
- "MA Line: Transparency" - sets the transparency of the lines
Search in scripts for "Up down"

Victory Trend (V20200718)VT Trend Ver 20200718
Description of VT Trend's items
VT Trend indicator is formed by Green & Red Main Trend Band , 4 days HLC Black color line , Mid Term line (Purple & Gray Color Line and Long Term Blue line . Green up arrow with "Buy" text and Red Down Arrow with "sell" text for alert the potential entry chances.
1) Green color Up Trend Main Trend Band with solid line : form by 2 moving average lines and in green color when fast moving average is above slow moving average line
2) Red Color Down Trend Main Trend Band with solid line form by 2 moving average lines and in red color when fast moving average is below slow moving average line
3) Green Up arrow with "buy" text appear : When red color down Trend Main Trend Band with solid line turn from red color to green color, mean potential buy entry
4) Red down arrow with "Sell" text appear : When green color up Trend Main Trend Band with solid line turn from Green color to red color, mean potential Sell entry
5) Black color line = 4 days HLC line
6) Mid term line = Purple color (when up) and gray color (when down)
7) Long term line = Coastal (Light blue) color
8) Stronger Up trend start = When Mid term line cross up Long term line
9) Stronger down trend start = When Mid term line cross down Long term line
10)Background color which represent the Up/down trend and stronger Up/down trend ,
a) lighten Green = Main trend in uptrend but Main trend's slow moving average line haven't cross up mid term line
b) Green =Main trend in uptrend and Main trend's slow moving average line had cross up mid term line
c) lighten Red = Main trend in down trend but Main trend's slow moving average line haven't cross down mid term line
d) Red = Main trend in down trend and Main trend's slow moving average line had cross down mid term line
Buy entry strategy No.1:
When Green arrow with "Buy" text appear and wait for the candlestick closed, and enter buy position on next candlestick .
Cut Loss exit: When Main trend turn into red color with Red down Arrow with "sell" text appear.
Target price no.1 : For hold over night. To close position When for Main trend turn into red color band and Red down Arrow with "sell" text appear.
Target price no.2 : For Intraday trade. To close position When price close below the black line
Buy entry strategy No.2:
After green up arrow appear and to add more position when Mid term purple line cross up Long term Blue line.
Cut Loss exit: When Main trend turn into red color with Red down Arrow with "sell" text appear.
Target price no.1 : For hold over night. To close position When for Main trend turn into red color band and Red down Arrow with "sell" text appear.
Target price no.2 : For Intraday trade. To close position When price close below the black line
Sell entry strategy No.1:
When Red arrow with "Sell" text appear and wait for the candlestick closed, and enter sell position on next candlestick .
Cut Loss exit: When Main trend turn into green color with green Up Arrow with "buy" text appear.
Target price no.1 : For hold over night. To close position When for Main trend turn into green color band and green Up Arrow with "Buy" text appear.
Target price no.2 : For Intraday trade. To close position When price close up the black line
Sell entry strategy No.2:
After Red Down arrow appear and to add more position when Mid term Gray color line cross down Long term Blue line.
Cut Loss exit: When Main trend turn into green color with green Up Arrow with "buy" text appear.
Target price no.1 : For hold over night. To close position When for Main trend turn into green color band and green Up Arrow with "Buy" text appear.
Target price no.2 : For Intraday trade. To close position When price close up the black line
"Use the link below to contact Owner for obtain access to this indicator"

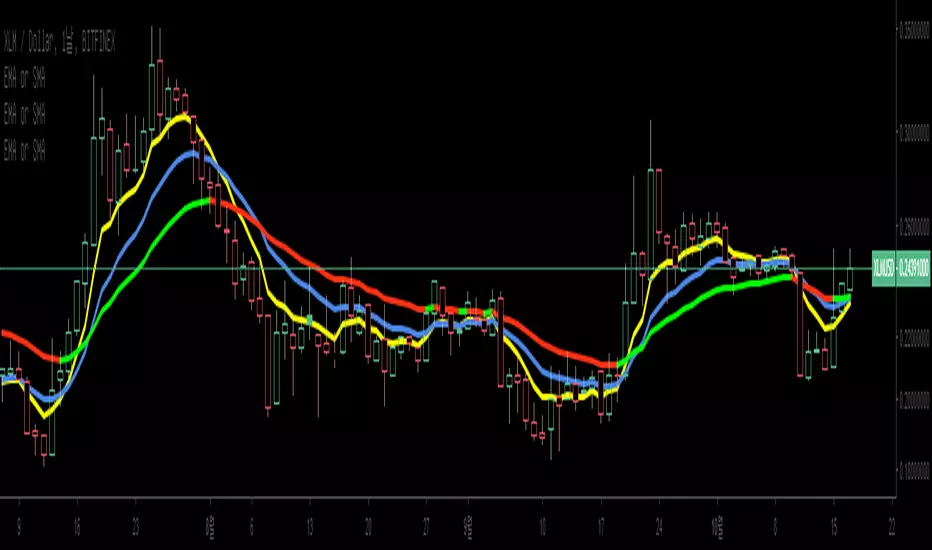
pivXmaspivXmas is a combined Moving Average based indicator.
pivXmas adds the following graphic functionalities to your chart:
- Adjustable Pivot-Bands with optional up-down-colored Middle-Line
- 4 Simple Moving Averages and/or 4 Exponential Moving Averages
OR an 8-segment Moving Average Ribbon
The Pivot-Bands are calculated by using time-spreaded averaged Lows and Highs.
The Length of the basic number of periods can be modified.
The brightness of all Pivot-Bands elements can be adjusted with one single control and a choice between
different color schemes is provided for convenience.
The Pivot-Bands Exponentialty can be set from 0 (Simple Moving Average) to 100 (Exponential Moving Average).
Furthermore, the Pivot-Bands Distance, the space between the upper and lower band, can be altered.
Depending on the timeframe, settings and other signals, part of a typical trading strategy could consist of
a long/buy when the price crosses the lower band from below back into the bands-range and a short/sell when
the price crosses the upper band from above back into the bands-range.
Roughly following the Middle Line curve and color also gives a good insight whether something is in an uptrend,
downtrend or in between.
The brightness of all Moving Averages can be adjusted with one single control.
The length and appearance for each Moving Average, 4 SMA's and 4 EMA's, can be modified individually.
The MA-Ribbon can be set to use simple or exponential Moving Averages. The MA-Ribbon uses the SMA/EMA 4 length
as the maximum length and the SMA/EMA 4 length divided by 8 (rounded) as the minimum length.
The MA-Ribbon consists of 8 subsequent Moving Averages. Color filling can be switched on and off.
Books have been written and many articles and videos have been made about the meaning and possible applications
of Moving Averages in trading.
A combination of these functions within pivXmas, together with the simple, yet quite usefull, visual options,
make it to a versatile indicator on every timeframe on any chart.

20 and 200 SMA indicators with unnecessary additionsAs many of you know, world famous Oliver Velez uses the simple 20 and 200 simple moving averages on 2 min time frame with price actions above or below these key SMAs for day/scalp trading involving narrow state versus wide state trend or anti-trend methods. The 20 SMA line uses different colors to indicate whether it is going up or down.
Against Oliver's advice, I also unnecessarily added boll bands on the 200 SMA, two +/- percent lines off 200 SMA to measure how far away prices are from the 200 SMA. I also added 10 ema cross 20 SMA cross signal, MACD line up /down, RSI crossover RSI SMA for those are want to make things complicated or might find they helpful. You can turn off all these ideally to Keep It Simple.
Again trading success is 80% psychology and 20% a good trading system plus risk management. Good luck.

Sequential Filter - An Original Filtering ApproachRemoving irregular variations in the closing price remain a major task in technical analysis, indicators used to this end mostly include moving averages and other kind of low-pass filters. Understanding what kind of variations we want to remove is important, irregular (noisy) variations have mostly a short term period, fully removing them can be complicated if the filter is not properly selected, for example we might want to fully remove variations with a period of 2 bars and lower, if we select an arithmetic moving average the filter output might still contain such variations because of the ripples in the frequency response passband, all it would take is a variation of high amplitude for that variation to be clearly visible.
Although all it would take for better filtering is a filter with better performance in the frequency domain (gaussian, Butterworth, Bessel...) we can design innovative approaches that does not rely on the model of classical moving averages, today a new technical indicator is proposed, the technical indicator fully remove variations lower than the selected period.
The Indicator Approach
In order for the indicator output to change the closing price need to produce length consecutive up's/down's, length control the variation threshold of the indicator, variations lower than length are fully removed. Lets see a visual example :
Here length = 3, the closing price need to make 3 consecutive up's/down's, when the sequence happen the indicator output is equal to src , here the closing price, else the indicator is equal to its precedent value, hence removing other variations. The value of 3 is the value by default, this is because i have seen in the past that the average smallest variations period where in general of 3 bars.
Because the indicator focus only on the variation sign, it totally ignore the amplitude of the movement, this provide an effective way to filter short term retracement in a fluctuation as show'n below :
The candle option of the indicator allow the indicator to only focus on the body color of a candle, thus ignoring potential gaps, below is an example with the candle option off :
If we activate the "candle" option we end up with :
Note that the candle option is based on the closing and opening price, if you use the indicator on another indicator output make sure to have the candle option off.
Length and Indicator Color
The closing price is infected by noise, and will rarely make a large sequence of consecutive up's/down's, the indicator can therefore be useful to detect consecutive sequence of length period, here 6 is selected on BTCUSD :
A consecutive up's/down's of period 6 can be considered a relatively rare event.
It is important to note that the color of the indicator used by default has nothing to do with the consecutive sequence detected, that is the indicator turning red doesn't necessarily mean that a consecutive down's sequence has occurred, but only that this sequence has occurred at a lower value than the precedent detected sequence. This is show'n below :
In order to make the indicator color based on the detected sequence check the "Color Based On Detected Sequence" option.
Conclusion
An original approach on filtering price variations has been proposed, i believe the indicator code is elegant as well as relatively efficient, and since high values of length can't really be used the indicator execution speed will remain relatively fast.
Thanks for reading !

Market Delta [Makit0]MARKET DELTA INDICATOR v0.5 beta
Market Delta is suitable for daytrading on intraday timeframes, is a volume based indicator which allows to see the UP VOLUME vs the DOWN VOLUME, the DELTA (difference) and the CUMULATIVE DELTA (cumulative sum of difference) between them
This indicator is based on contracts volume (data avaiable), not in ask/bid volume (data not avaiable)
The up/down volume is calculated at each candle as follows:
- calculate the ticks of the range, top wick and bottom wick
- calculate the ticks up and ticks down to get the total ticks of the candle
- calculate the volume per tick as total volume divided by total ticks
- calculate the up and down volume as volume per tick multiplied by up ticks and down ticks
The delta is calculated as volume up minus volume down
The cumulative delta is a cumulative sum of delta and is resetted to 0 twice a day at the globex open and at the us cash open
By default the indicator plots the 'CANDLE MODE' which is useful for charting the cumulative volume to find out support and resistance zones where the volume is rejected or pass thru, as the volume moves so does the price, price always follows the volume, price goes away from where volume dries and price auctions comfortable where is plenty of volume, in a way PRICE FEEDS ON VOLUME
An indication about the plotting style in the volume, delta and cumulative delta modes: I can't use histogram as intended due a bug at autoresizing the scale in the candle mode, so the styles used are areabr and circles.
FEATURES
- Plot volume in one of four modes: Volume Up/Down, Delta, Cumulative Delta, Cumulative Delta as Candles
- Cumulative delta resetted twice a day (globex and cash open)
- Show a base line at 0
SETTINGS
- Mode: select one of the four volume output modes: Volume, Delta, Cumulative Delta and Candles. Candles by default
- Show zero line: show/hide the zero base line. False by default.
HOW TO SETTING UP THE INDICATOR:
BE AWARE, by default the indicator settings are configured for using the Cumulative Delta Candle Mode
- Candles Mode Settings: configured by default, mode candles and zero line off
- Volume, Delta, Cumulative Delta Mode Settings: select the mode you want and switch on/off the zero line
GOOD LUCK AND HAPPY TRADING

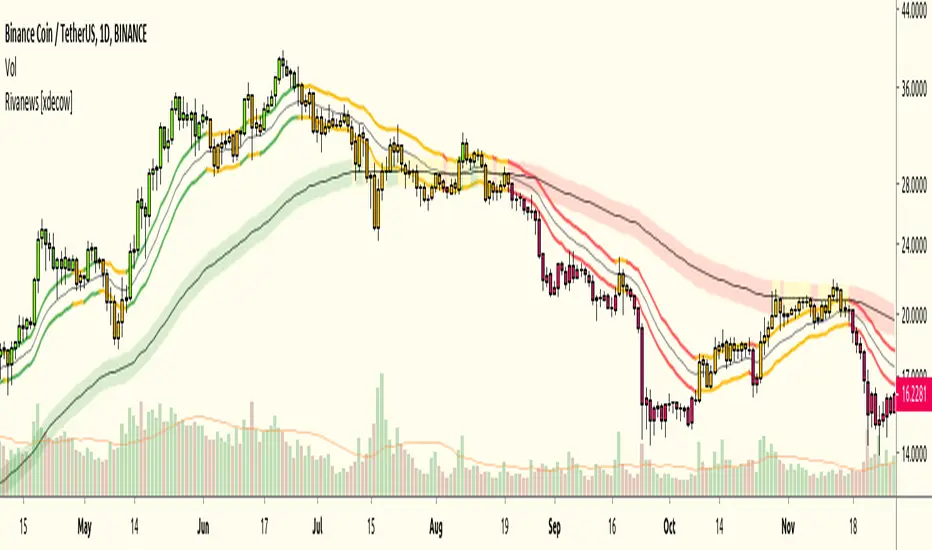
Rivanews Setup - Riva-Keltner, Média Rock [xdecow]This setup was created by Rivadavila S. Malheiros
There are 2 Keltner Channels with exponential moving averages of 21 (riva) and 89 (rock) and ATR multiplier of 0.618.
When the price is between the bands, it is a sign of consolidation (yellow).
When the price is above the bands, it is an upward trend (green).
When the price is below the bands, it is a downward trend (red).
When the price crosses rock 89 and closes up / down, it may be a sign of a reversal. But it has a high probability of testing rock 89 again.
------------------------------------------------------------------------------------------
PT-BR
Este setup foi criado por Rivadavila S. Malheiros
São 2 Keltner Channels com médias móveis exponenciais de 21 (riva) e 89 (rock) e multiplicador do ATR de 0.618.
Quando o preço está entre as bandas, é sinal de consolidação (amarelo).
Quando o preço está acima das bandas, é uma tendencia de alta (verde).
Quando o preço está abaixo das bandas, é uma tendencia de baixa (vermelho).
Quando o preço cruza a rock 89 e fecha acima/abaixo, pode ser sinal de reversão. Mas tem uma alta probabilidade de testar a rock 89 novamente.
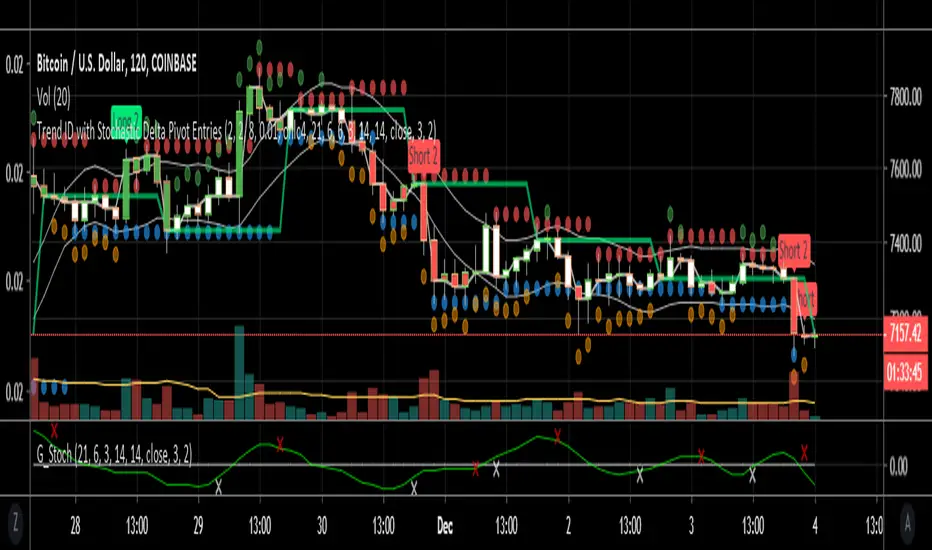
Trend ID with early entry signalsThis script is a combination of two. Firstly a trend is identified as up down or sideways. Higher highs and higher lows makes for an uptrend, lower highs and lower lows similarly allows for a downtrend to be registered. Users can adjust the number of bars to include for detection of the pivot points to increase the accuracy of trend changes but this significantly reduces signals. Sideways movement is determined if the average candle price is within a variance of a short SMA. The SMA follows the close of each candle going back 6 candles by default. The variance is 1% by default so if the price is within 1% of the SMA it's considered sideways and no entries can be issued in this condition.
The indicator is designed to identify the trend for longing or shorting, and then provides the entries based on stochastics converging or diverging (not crosses). The convergence and divergence of stochastics is amalgamated into a short EMA which also has length 6 and can be tuned by the user.
The default values of this script best work on 1h and 2h timeframes for specific pairs like BTCUSD. For other time frames and pairs the settings will need to be tweaked but is possible to identify specific parameters for many different pairs and time frames.
I've written several scripts for personal use however this is my first published script so please use at your own risk! It's not perfect!
[SignalFI] VolumeFI (Weiss Wave)
VolumeFI uses our proprietary DynaFIB EMA Moving average to create a unified volume trend that leverages Weiss Wave mechanics. There are a few items to note with the use of this tool:
1) The Volume wave created can be customized, becoming more sensitive if the EMA Length is changed in the settings. By default the value is 6, and I would not go below 3 or above 9 for this setting to remain relevant to the trend.
2) By default background coloring is disabled. If enabled, the background color of the indicator will correspond to the trend squares that are presented at the top of the Wave bars. This does not show any additional functionality other than presenting the Rising and Falling effect of volume in a more pronounced way. This is simply to please some traders that would like a more "obvious" representation of the current trend presented by VolumeFI.
3) Small up and down labels are presented which indicate bull and bear volume spikes. These signals can be categorized into to two forms. When the signal presents itself at the start or in the middle of trend, the signal can be considered "supportive" of the trend. When the signal presents itself at the "top" or "bottom" of a trend (based on other confluence), it can be interpreted as "non-supportive" of the trend.
Said another simpler way, the small up/down labels represents impulses of positive trend supporting volume, or can indicate "exhaustion" of the trend when seen after a longer volume wave.
These bars can also provide notice of a reversal when opposite colored signals are presented on Volume Wave bars. When you see a "Blue" (Bull) volume spike on a red wave, and in succession that would indicate that volume is attempting to reverse the downward trend. The same goes for multiple "Red" (Bear) volume spikes seen on a blue wave.

Multi-TF Avg BBandsMULTI-TF AVERAGE BBANDS - with signals (BETA)
Overall, it shows where the price has support and resistance, when it's breaking through, and when its relatively low/high based on the magic of standard deviation.
created by gamazama. send me a shout if u find this useful, or if you create something cool with it.
%BB: The price's position in the boilinger band is converted to a range from 0-1. The midpoint is at 0.5
Description of parameters
"BB:Window Length" is the standard BB size of 20 candles.
The indicator plots up to 7 different %BB's on different timescales
They are calculated independently of the timescale you are viewing eg 12h, 3d, 30m will be the same output
You can enter 7 timescales, eg. if you want to plot a range of bbands of the 12h up to 3d graphs, enter values between 0.5 and 3 (days) - you can also select 0 to disable and use less timescales, or select hours or minutes
Take note if you eg. double the main multiplier to 40, it is the same as doubling all your timescales
You can turn the transparency of the 7 x %BB's to 100 to hide them, their average is plotted as a thick cyan line
"Variance" is a measure of how much the 7 BB's agree, and changes colour based on the thresholds used for the strategy
---- TO START FROM SCRATCH ----
- set all except one to ZERO (0), set to 0, and everything after to 0.
Turn ON and right click -> move the indicator to a new pane - this will show you the internal workings of the indicator.
Then there is a few standard settings
"Source Smoothing Amount" applies a basic small sma on the price.
It should be turned down when viewing candles with less information, like 1D or more.
Standard BBands use an SMA, there one uses a blend between VWMA or SMA
Volume Weight settings, the same as SMA at 0, and the same as VWMA at 1
BB^2 is a bband drawn around the average %BB. Adjust the to change its window length
The BB^2 changes color when price moves up or down
Now its time to look at the parameters which affect the buy/sell signals
turn on "show signal range" - you see some red lines
buy and sell each have 4 settings
min/max variance will affect the brigtness of the signal range
range adjust will move the range up/down
mix BB^2 blends between a straight line (0) and BB^2's top or bottom (1)
a threshold of "variance" and "h/l points" is available to generate weaker signals.
these thresholds can be increased to show more weak signals
ONCE YOU ARE HAPPY WITH THE SIGNALS being generated, you can turn OFF , and move it back to the price pane
the indicator then draws a bband around the price to maps some info into the chart:
fills a colour between 0.5 & the mid BB^2 and converts relative to the price chart
draws a line in the middle of the midband.
controls how much these lines diverge from the price - adjust it to reduce noise
converts the signal range (red lines) to be relative to the price chart
if you like, you can adjust the sell & buy signals in the tab from and to and to match the picture. It messes with auto-scaling when moving back to though
enjoy, I hope that is easy enough to understand, still trying to make this more user-friendly.
If you want to send me some token of appreciation - btc: 33c2oiCW8Fnsy41Y8z2jAPzY8trnqr5cFu
I promise it will put a fat smile on my face

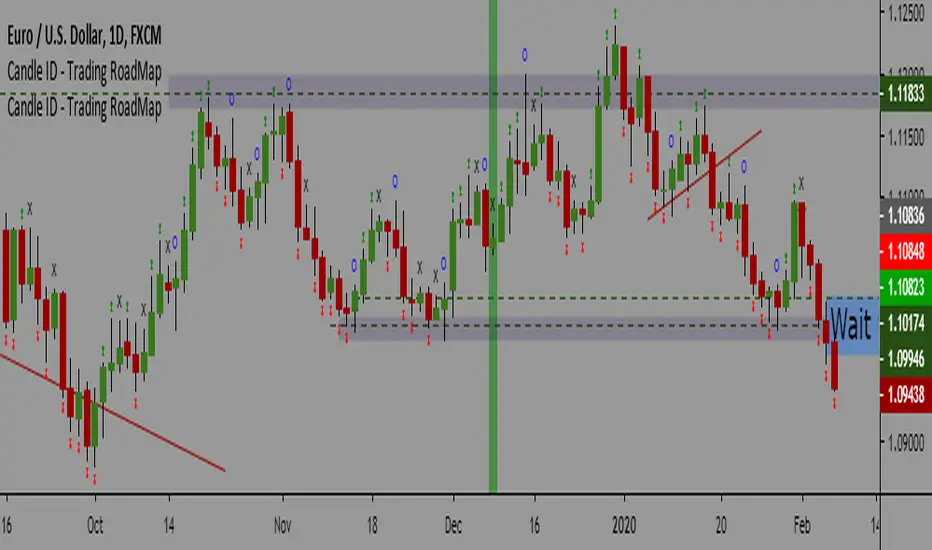
Candle ID - Trading RoadMapCandle ID- Trading RoadMap
Simple Script to show
- Inside Bar
- Outside Bar
- Up Bar: Bar with a Higher Hi in comparison to the previous bar
- Down Bar: Bar with a Lower Low in comparison to the previous bar
Have a peaceful and profitable trading day 😊
Khaled Maziad
Karobein OscillatorDeveloped by Emily Karobein, the Karobein oscillator is an oscillator that aim to rescale smoothed values with more reactivity in a range of (0,1)
Calculation
The scaling method is similar to the one used in a kalman filter for the kalman gain.
We first average the up/downs x, those calculations are similar to the ones used for calculating the average gain/loss in the relative strength index.
a = ema(src < src ? x : 0,length)
b = ema(src > src ? x : 0,length)
where src is a exponential moving average of length period and x is src/src in the standard calculations, but anything else can be used as long as x > 0 .
Then we rescale the results.
c = x/(x + b)
d = 2*(x/(x + c*a)) - 1
How To Use
It is better to use centerline-cross/breakouts/signal line.
In general when we use something smooth as input in oscillators, breakouts are better than reversals, you can see this with the stochastic and rsi.
So a simple approach could be buying when crossing over 0.8 and selling when crossing under 0.2.
Here is the balance of a strategy using those conditions, length = 50 .
20 trades have been mades since the 29 oct we made 341 pips with eur/usd, of course this backtest was made during good trends period,
this result is not representative of how the strategy work with other conditions/markets.
For any questions/suggestions feel free to contact me

Katana Gaps Bounty Hunter Pro (Show Gaps of All Types) by RRBKatana Gaps Bounty Hunter Pro (KGB Hunter Pro, Gap Exterminator) by RagingRocketBull 2018
Version 1.0
This indicator shows/counts/filters gaps on a chart.
There are several versions: Simple, Pro, Advanced and Zones. This is the Pro version. The Differences are listed below.
- Simple: shows/counts gaps, changes color based on gap dir (2 colors), filters out price gaps within session, large gaps, and high volume gaps
- Pro: +shows all types of gaps, multi color, pro filters (full/partial/overlapping time, price, large, candle, volume, doji, weekend gaps within delta ranges)
- Advanced: +session times mask, show/count gaps only for last N bars, +min/max/filled gaps stats, dark mode
- Zones: +shows gaps as dynamic horiz zones
KGB Hunter Pro Gap Exterminator focuses on showing you all possible types of gaps in multiple colors. Gap theory states that price tends to return and fill the gaps,
so you can use it to collect the bounty. You can apply any combination of complex filters to narrow down search results i.e., find only all:
- type 3 gaps up with allowed wick-candle overlapping of up to 10% and
- gap size larger than 200 and
- with at least one of the candles larger than 100 and
- volume change at least 40 and
- spanning less than 2 bar periods and
- excluding weekend gaps
Features:
- highlights gaps using barcolor and plotchar chars (8 colors x 2 dirs)
- supports all 3 types of gap overlapping: full gap (no overlapping), wick-wick and wick-body overlapping up to a specified % of candle body
- finds all types of gaps with pro filters for price, time, large, volume, timerange, candle size, doji gaps
- individual show/hide flags for each gap/char based on gap type
- can show/hide gaps/chars based on gap dir
- changes color of gaps/chars based on gap dir/type, multi color gap type combos
- displays chars above/below bar based on gap dir
- can show/hide weekend gaps
- counts all filtered gaps
Colors:
Basically There are 2 gap types (Price, Time) x 2 directions (Up, Down) x 2 modifiers (Large, Volume), Volume Gap is a separate class with its own modifiers, so more accurately:
- (Price, Time) x 2 directions (Up, Down) x Large modifier
- (Price Volume, Time Volume) x 2 directions (Up, Down) x Large modifier
using a total of 16+1 colors or 8+1 base colors + transparency modifier
depending on settings you can highlight gaps using any multi color combo from just 1 to all 16 colors (+1 gray color for weekends).
basic gap = 1 base color with normal transparency
price,time = 2 base colors (including basic gap) with normal transparency (+1 color)
* up,down dir = +2 new base colors with normal transparency (including 2 base colors), with a total of 2*2 = 4 price/time base colors (+2 colors)
* large = same 4 base colors with vivid transparency modifier (+4 colors)
* volume = +2 new base colors with normal transparency, a separate class (+2 colors)
* volume * up,down dir = +another 2 new base colors with normal transparency (including 2 volume base colors), with a total of 2*2 = 4 volume base colors (+2 colors)
* volume * large = 4 volume base colors with vivid transparency modifier (+4 colors)
weekend_gap = gray (+1 color)
doji gap, candle gap, timerange gap = no special color, inherits color from parent gap type
for more details, please see the Gap Color Hierarchy comments in code
_________________________________________________________________________
You can find the following gap related terminology in literature: full, partial, extreme, breakaway, runaway/continuation, common, exhaustion gaps.
There are no exact rules to distinguish between them, so this can't be implemented.
When defining a gap it all boils down to how do you plot a gap, which points between adjacent candles do you consider a gap. Different sources apply different methodology
but in practice only 3 types of gap overlapping can exist:
- full gap (no overlapping),
- partial (wick-wick overlapping) and
- extreme partial (wick-body overlapping up to a specified % of a candle body)
All these types are supported in this script. The only possible remaining option is candle-candle overlapping which is not a gap by definition.
Many other script specific subtypes are also supported. Please see description of each gap type below and comments in code.
General display modes
- gap has 3 possible overlapping modes: full gap (no overlapping), wick-wick overlapping, wick-candle overlapping up to a specified % of candle body size (for mode 3 only)
the remaining candle-candle overlapping implies not a gap by definition
full gap mode will find the least amount of gaps, wick-candle - the most
- gap can be either price or time, up or down, and shown above or below the candles (gap chars)
- by definition, a price gap is a smaller subset of a time gap, a gap within current session with a price gap and zero time lag between bars.
Therefore timerange filter is useless for price gaps, but can still be applied.
On the other hand, all price gap filters can be applied to time gaps without any distinction.
- gap can have multiple modifier subtypes: (price|time) * (up|down) * (large? + volume? + doji? + timerange? + weekend?)
i.e. price + large + volume + doji or time + large + volume + timerange + doji + weekend
- the gap is always counted only once no matter how many subtype modifiers it has
- if the gap does not satisfy any of the applied flags/filters it is not shown/counted (no gap bars/chars are shown)
- gap color can depend on a combo of gap type/dir and modifier subtypes or can be shown in a single base color
- char color can only depend on gap dir (not type/modifiers) or can be shown in a single base color
- char position can also depend on gap dir (above/below) the gap candle. Alternatively you can pin chars to the top/bottom of the screen in UI Styles.
- change_by_type = true - uses gap type base colors (2 colors + optional modifiers, up to 8 colors if volume and/or large filters are enabled)
- change_by_dir = true - uses gap dir base colors (2 colors + optional modifiers, up to 8 colors if volume and/or large filters are enabled)
- both change_by_type and change_by_dir = true - uses both gap type and dir base colors (4 colors + optional modifiers, up to 16 colors if volume and/or large filters are enabled)
- both change_by_type and change_by_dir = false - uses a single base gap color (1 color)
- don't need that much colors - disable filters
- highlight bars has priority over individual gap flags, when it is false all gaps are hidden regardless of their corresponding flag settings (does not affect dim weekend gaps)
- show chars has priority over individual gap char flags, when it is false all char flags are hidden regardless of their corresponding flag settings
- price gaps are only shown/counted when show_price_gaps flag is true. The large or volume filters can be used to narrow down results further.
- time gaps are only shown/counted when show_time_gaps flag is true. The large, volume, and timerange filters can be used to narrow down results further.
- doji gaps are only shown/counted when show_doji_gaps flag is true. The doji candle size and other filters can be used to narrow down results further.
- show weekend gaps = true and dim weekend gaps = false - shows/counts weekend gaps
- show weekend gaps = true and dim weekend gaps = true - dims weekend gaps, doesn't show/count weekwend gaps
- show/dim weekend gaps do just that - show the gap if it happens on a weekend, not all weekends
- large gaps are only shown/counted when the large filter is enabled != 0. positive values 5 (>= 5), negative -5 (<=5) are used to switch between <>
- volume gaps are only shown/counted when the volume filter is enabled != 0. positive values 5 (>= 5), negative -5 (<=5) are used to switch between <>
- timerange gaps are only shown/counted when the timerange filter is enabled != 0. positive values 5 (>= 5), negative -5 (<=5) are used to switch between <>
- candle size gaps are only shown/counted when the candle size filter is enabled != 0. positive values 5 (>= 5), negative -5 (<=5) are used to switch between <>
- candle size filter is the only filter with 2 arguments, use_and_for_delta to enable AND condition for the args (OR is the default)
Good Luck! Feel free to explore and learn from the code

EMA or SMA slope Indicator and alarmIf exponential is checked in setting, it is EMA. If unchecked, it is SMA.
The color changes according to the slope of the moving average line.
When the slope of the moving average line changes, the alarm can be set according to UP and DOWN.
지수이동평균선 또는 기본이동평균선 기울기 표시기 및 알람 지표 입니다.
설정에서 exponential 을 체크하면 EMA 이며 체크하지 않으면 SMA 입니다.
이동평균선의 기울기에 따라 컬러가 바뀝니다.
이동평균선의 기울기가 바뀔때 UP,DOWN에 따라 알람을 설정 할 수 있도록 하였습니다.
Rocket number 1Rocket number 1
Class : oscillator/trend
Trading type : intraday
Time frame : 15 min
Purpose : reverse points identification
Level of aggressiveness : aggressive
Indicator « Rocket number 1 » generates synthetic support/resistance lines, using the Gaussian distribution for 2 exponentially weighted moving averages, corrected on multiplied standard deviations of these averages.
Simply put, indicator calculates support/resistance zones, generates trading signals and provides information about stop-loss and take-profit values. That is, gives everything a trader needs for professional activity.
Despite the fact that indicator « Rocket number 1» is of oscillatory nature, its algorithm provides preliminary filtration of the oscillatory signals. Only those which are in the local tendency are allowed. That means in case of local downward tendency all the oscillatory “buy” signals will be forbidden and will not be displayed on the chart. This will allow to increase overall quality of the indicator and to increase the % of successful trades,
Structure of the indicator
Indicator consists of 2 blocks:
- oscillatory block – responsible for reverse points identification;
- trend block – is used for the filtration purposes.
The main visual elements of the indicator are:
- Red zone – sell zone. Entering this zone means local price overbought and shows that price reached the resistance line. From this place the likelihood of up-down price reverse is maximum;
- Blue zone – buy zone. Entering this zone means local price oversold and shows that price reached the support line. From this place the likelihood of price down-up reverse is maximum;
- Green line – middle line of the price channel. Used to define take-profits for the most aggressive trades;
- Orange line – local trend line. Only signals in direction of this line are allowed;
- Maroon line (the highest line) – displays stop-loss values for the short positions (sells);
- Dark blue line (the lowest line) – displays stop-loss values for the long positions (buys);
Only permitted signals are displayed on the chart in form of triangles with according color: blue triangles for the “buy” signals and red – for the “sell” ones.
Input parameters of the indicator
To set up the indicator a number of input parameters are used:
- EMA 1 period – period of the fast average (by default 8);
- EMA 2 period - period of the slow average (by default 13);
- TrendLine period – period used to detect trend (by default 55);
- Number of deviations – multiplier of the standard deviations number. This parameter is responsible for the level of aggressiveness of the indicator. The lower the parameter is the more aggressive indicator is, but this can reduce the quality of the signals.
Rules of trading
Appearance of a blue triangle on the chart is a “buy” signal, a red one – is a signal for “sell”. Take-profits are set near the green line (case of fast trades of partial profit fixation) or to the nearest blue zone (case of “sell” trades) and nearest red zone (case of “buy” trades)
For short positions (“sell”) stop-loss is set near the maroon line. For the long positions (“buy”) stop-loss is set near the dark blue line.

KenjiKenji
Class : average analysis
Trading type : intraday
Time frame : 4H
Purpose : work in trend
Level of aggressiveness : standard
Indicator «Kenji» is a brand new look on the average analysis. The main problem of most of the trading strategies and indicators based on average analysis is a number of false signals in case of flat (for example frequent crossing of the averages, frequent changes of the average direction etc). As the result average analysis can’t show its real power and effectiveness.
Indicator «Kenji» using a unique algorithm allows avoiding the most common traps of the average analysis and significantly increasing the quality of the signals.
It generates signals for the comfort trading in local trend. Indicator provides information both on timing of the position entry and timing on profit fixation. Also it helps to determine the level of aggressiveness of the concrete signal. This makes «Kenji» indicator a very useful tool for amateur and experienced traders.
Structure of the indicator
Indicator consists of colored zones and level lines:
- colored zones (marked blue, red or green) – used for color identification of the trading possibilities and to detect the entry points;
- level lines (marked red and blue depending on current price direction) – used for color identification of the fact that current price direction is up/down.
To ease the trading process indicator displays on the chart “buy” and “sell” signals. These signals are divided into 2 groups: standard (trading with basic lot size) and aggressive (trading with double basic lot size). Take-profit zones are also displayed on the chart. They are represented with the blue/red x-crosses. Red x-crosses show zones where profits on “sell” positions should be taken. Blue x-crosses show zones where profits on “buy” positions should be taken.
Input parameters of the indicator
To set up the indicator a number of input parameters are used:
- Slow Average Period – period of the slow average. The bigger the period is the more conservative reaction of the average for the price changes are.
- Fast Average Period - period of the fast average. The bigger the period is the more conservative reaction of the average for the price changes are.
- Correlation Period – period used in correlation analysis to calculate the level of interconnection between the averages.
Rules of trading
When signal “buy”/”sell” is appeared on the chart corresponding trade should be opened.
Profit for “sell” position should be fixed when the red x-cross appears on the chart. Profit for “buy” position should be fixed when the blue x-cross appears on the chart.

Brandon: Fractals MKIICustom Indicator development published for customer verification and acceptance.
Features
Generate buy / sell signals if x number of candles following a fractal are up/down.
Generate an early warning (background color change) if x - 1 candles following a fractal are up/down
Generate alerts for buy/sell signals and early warning.

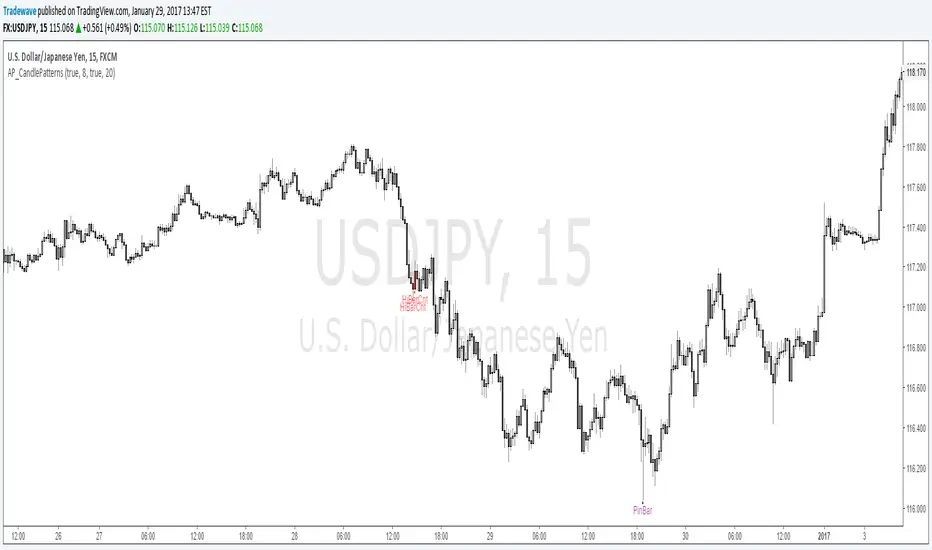
AP_CandlePatternsCreated by : Andrew Palladino
Date: 1/29/2017
This indicator displays a message above/below a bar when certain candle patterns appear. The indicator currently supports two candle patterns.
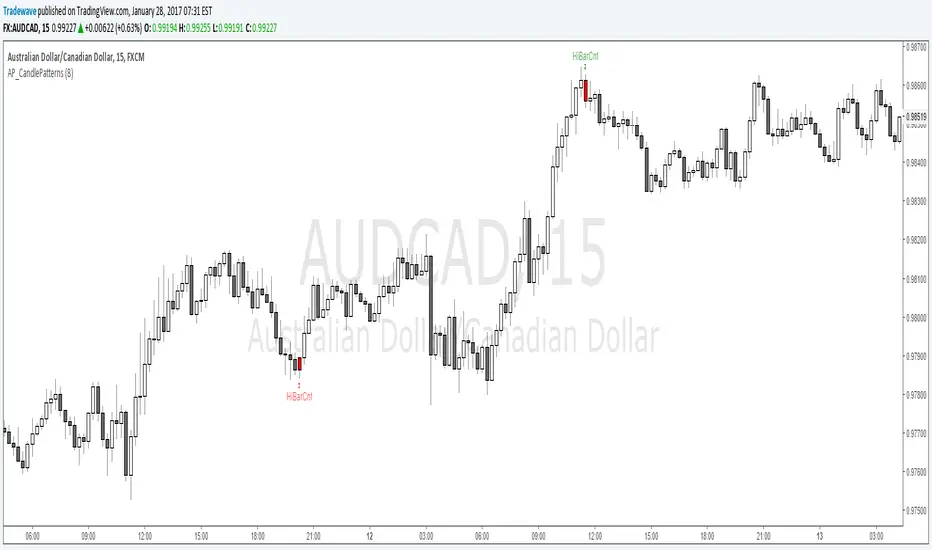
Consecutive Up/Down Bars:
The indicator searches for instances where there are more than n number of consecutive up bars or down bars on a given time frame. For example, the user can specify the minimum number of consecutive up/down bars, default is set to 8. When the number of consecutive up/down bars is greater or equal to 8, a label will be displayed above the high, for up bars, and below the low for down bars. The color of the next candle will turn red when the criteria is met.
Bearish/Bullish Pin Bar Reversal Signals:
The indicator will alert the trader when there is a bearish or bullish Pin bar reversal on the current time frame.
The trader has the ability to enable or disable individual candle formations. Additional patterns will be added in the future.
AP_CandlePatterns_v1The indicator currently only looks for instances where there are more than n number of consecutive up bars or down bars on a given time frame. For example, the user can specify the minimum number of consecutive up/down bars, default is set to 8. When the number of consecutive up/down bars is greater or equal to 8, a label will be displayed above the high, for up bars, and below the low for down bars. The color of the next candle will turn red when the criteria is met.
Additional candle patterns will be added in the near future.
Gleeson Trend Tracker (GTT) IndicatorComprehensive Trend Trading System Indicator made up of the four components to help you successfully trade market trends:
Entry Signals (Green & Red Arrows)
The entry arrows indicate entry conditions are present. Green for long entries and red for short entries. If you already in position in the direction of an entry signal, ignore it. Switch to position maintenance mode for that market once trading a market.
Current Trend Status Channels (Red/Green Overlay)
The channel overlay is intended to indicate whether the market has recently trended up/down. Green if moving higher, Red if moving Lower. Channels make it easier to visualise current & previous price trajectory.
On Close Stop Loss (OCSL) / Price Average (40 MA) Blue line
This acts both as the "line in the sand" in relation to trend direction but also importantly as your (OCSL) or sometimes also known as mental stop. If price closes beyond this line in the opposite direction to your position, exit the position. It's important to wait for price to close (this methodology works best on weekly charts so make entry & exit decisions when the market is closed). This method works best if you risk 1% per trade using the distance from entry price to the OCSL as your pre-defined risk, back-analysis confirms this.
Hard Stop Loss Red line
This line is your circuit breaker intended to protect your capital from sudden adverse moves. This line serves as the price for your fixed or hard stop loss point that should be entered with the order. The formula behind this line is risk * 2 (so 2% if you risk 1% between entry price and OCSL). HSL is your safety net, always use it.
Some other advice on how to trade this methodology:
Analysis Sunday, entries & exits Monday (so you can also have a life)
Do not pyramid with this system, it works best with individual entries spread across a range of markets including FX, Indices, Commodities and Interest Rates.
Risk only 1% per trade
This methodology works best over weekly/monthly charts. You want to capture moves that last weeks/months/years. I would not advise day trading this system.
If you have any feedback or need further help, email me at me@jackgleeson.co.uk
Good Luck!

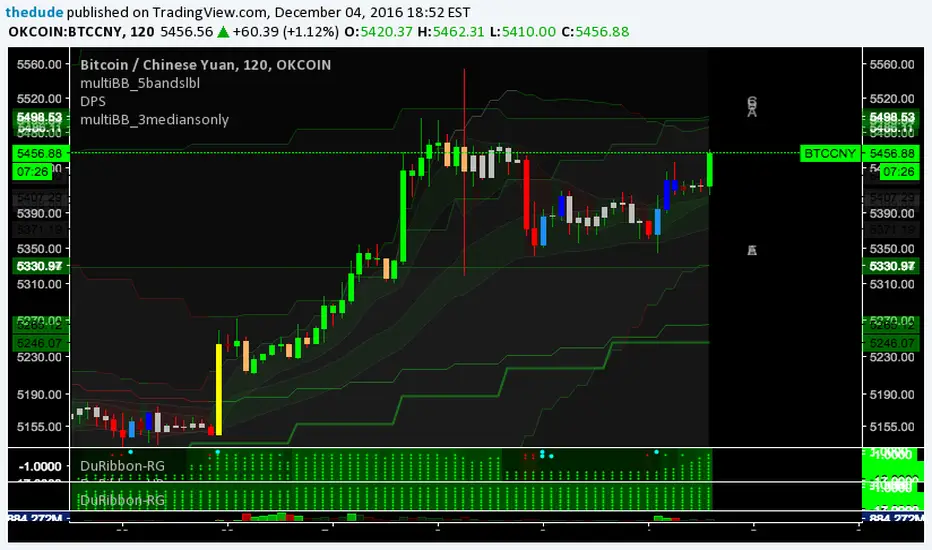
Dudes Ribbon Down Only - Beta 3 [custom res fix]Dude's Multi Time-Frame Pivot System BETA 3
This is the third beta release of a new "ribbon" type of indicator which shows trend information and pivot candle information for 8 different timeframes, all within a very compact and visually appealing space.
It is extremely useful for pinpointing trend changes or current trend by giving you information from 8 different timeframes on one chart. The idea is if multiple time-frames are in sync with each other, the stronger the signal will be. You can easily set alarms on pivot points to trigger Tradingview to send an email or SMS when an important signal appears on the chart. To trigger an alarm on a pivot alarm trigger, select the indicator in the alarm and choose 'Buy Alarm", "Sell Alarm", "Green Alarm", or "Red Alarm", depending on the indicator you are setting the alarm for. For the pivot alarm trigger, the drop down box specifying the resolution will have no effect, so you can ignore it. You may also set individual alarms for each resolution. To do this, choose the indicator in the drop down menu, then choose the resolution in the drop down menu next to that one, and finally choose"Cross Up" and set the value to 0.5. The value of the variable holding candle data is a binary 0 or 1.
The ribbon strategy is split into 3 different indicators because of the large amount of code required to calculate everything; Up, Down, and Red/Green. Please contact me if you are interested in purchasing a subscription to the strategy or want more information. The current subscription price is starting at $50USD on a monthly basis. I plan on doing bulk trials that will start and end for a select group of people at the same time. Contact me here on Tradingview via PM, or via email thedudeontv@gmail.com if you are interested.

Dudes Ribbon Down Only - Beta 3Dude's Multi Time-Frame Pivot System BETA 3
This is the third beta release of a new "ribbon" type of indicator which shows trend information and pivot candle information for 8 different timeframes, all within a very compact and visually appealing space.
It is extremely useful for pinpointing trend changes or current trend by giving you information from 8 different timeframes on one chart. The idea is if multiple time-frames are in sync with each other, the stronger the signal will be. You can easily set alarms on pivot points to trigger Tradingview to send an email or SMS when an important signal appears on the chart. To trigger an alarm on a pivot alarm trigger, select the indicator in the alarm and choose 'Buy Alarm", "Sell Alarm", "Green Alarm", or "Red Alarm", depending on the indicator you are setting the alarm for. For the pivot alarm trigger, the drop down box specifying the resolution will have no effect, so you can ignore it. You may also set individual alarms for each resolution. To do this, choose the indicator in the drop down menu, then choose the resolution in the drop down menu next to that one, and finally choose"Cross Up" and set the value to 0.5. The value of the variable holding candle data is a binary 0 or 1.
The ribbon strategy is split into 3 different indicators because of the large amount of code required to calculate everything; Up, Down, and Red/Green. Please contact me if you are interested in purchasing a subscription to the strategy or want more information. The current subscription price is starting at $50USD on a monthly basis. I plan on doing bulk trials that will start and end for a select group of people at the same time. Contact me here on Tradingview via PM, or via email thedudeontv@gmail.com if you are interested.

Dudes Ribbon Up Only - Beta 3This is the third beta release of a new "ribbon" type of indicator which shows trend information and pivot candle information for 8 different timeframes, all within a very compact and visually appealing space.
It is extremely useful for pinpointing trend changes or current trend by giving you information from 8 different timeframes on one chart. The idea is if multiple time-frames are in sync with each other, the stronger the signal will be. You can easily set alarms on pivot points to trigger Tradingview to send an email or SMS when an important signal appears on the chart. To trigger an alarm on a pivot alarm trigger, select the indicator in the alarm and choose 'Buy Alarm", "Sell Alarm", "Green Alarm", or "Red Alarm", depending on the indicator you are setting the alarm for. For the pivot alarm trigger, the drop down box specifying the resolution will have no effect, so you can ignore it. You may also set individual alarms for each resolution. To do this, choose the indicator in the drop down menu, then choose the resolution in the drop down menu next to that one, and finally choose"Cross Up" and set the value to 0.5. The value of the variable holding candle data is a binary 0 or 1.
The ribbon strategy is split into 3 different indicators because of the large amount of code required to calculate everything; Up, Down, and Red/Green. Please contact me if you are interested in purchasing a subscription to the strategy or want more information. The current subscription price is starting at $50USD on a monthly basis. I plan on doing bulk trials that will start and end for a select group of people at the same time. Contact me here on Tradingview via PM, or via email thedudeontv@gmail.com if you are interested.